A web app for taking screenshots of maps using Protomaps and MapLibre
At the start of May, my partner and I will be moving from Australia to live in Paris for a year. We’re really excited! I’ve been trying to learn a bit more French before our move, so I’ve been using the spaced repetition app Anki to learn vocabulary.
I’m also keen to learn a bit of European geography, to help with navigation. I’ve been using this shared Anki deck to help me memorise the locations of European countries on a map.
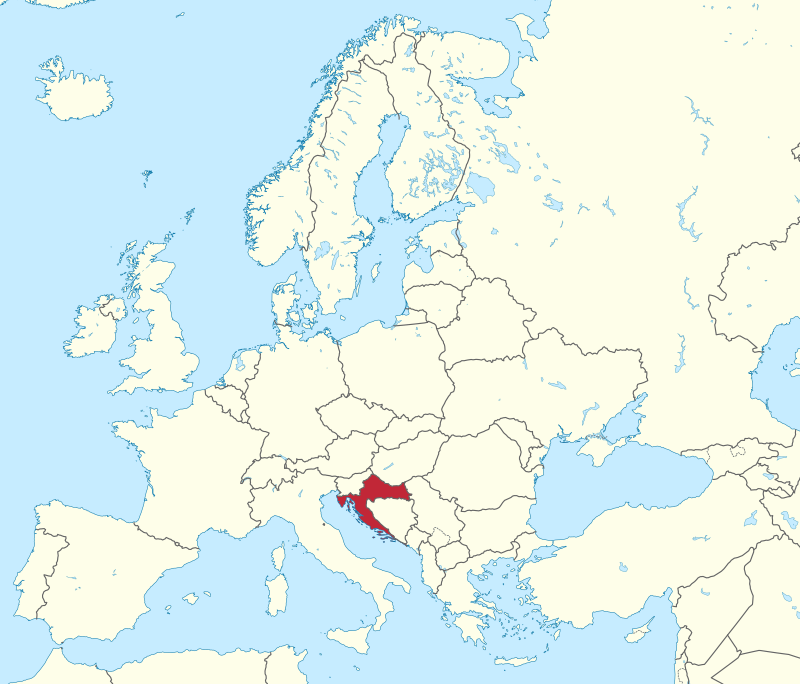
For example, where on the map is Croatia?
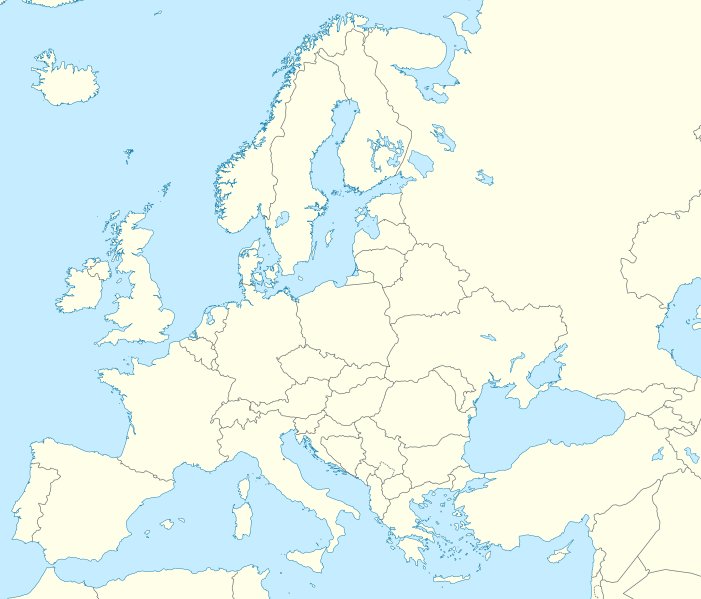
Show the answer
Last month, I came across the open source mapping libraries Protomaps and MapLibre. These libraries make it possible to integrate maps into a web app using OpenStreetMap’s dataset. I thought it would be interesting to try making a little web app to generate screenshots of maps with locations highlighted. This could help me learn landmarks in Paris, and make me a bit more confident when travelling.
After a bit of experimentation with the Protomaps and MapLibre libraries, and a lot of help from Bishal Sapkota’s geojson.app project, I’ve got a little demo up and running! In the blog post below, I’ll explain how I got it working, and how you can try it out for yourself.
Experimenting with Mapbox
To get a feel for how mapping libraries work in a web app, I started with the examples on the Mapbox website. Mapbox is a popular set of APIs and services, and has some good documentation for getting started.
Because my app is a hobby project with only a couple of users, my usage would fit in Mapbox’s free tier. Mapbox only becomes expensive if your app has more than a few thousand users.
But I wanted to learn more about the open-source mapping libraries Protomaps and MapLibre, just for my own knowledge, and to work out what is possible with OpenStreetMap’s dataset.
Poking around the geojson.app project
Bishal Sapkota’s geojson.app project is a great example of a React app using Protomaps and MapLibre:
- It uses MapLibre for the interactive map on the frontend. MapLibre renders the map into a
<canvas>element and visualises the GeoJSON data using markers, lines and polygons. - It uses Protomaps to self-host the vector map tiles. As you navigate around the map, it loads the tile data from tiles.geojson.app.
You can learn more about the project in Bishal’s recent talk ‘Beyond Mainstream Maps’ at MelbJS.
I learned a lot by poking around the source code of Bishal’s project. By learning how to get a map working, and how to draw markers and polygons, I was able to get a head start on my own project.
Self-hosting the vector map tiles
In order to get my own app up and running, I needed to self-host my own vector map tiles. Here’s what the process involved:
- using the pmtiles CLI to extract the vector map data for the Paris region, from the global OpenStreetMap dataset. The pmtiles file for the whole world is about 110GB, but the Paris region is only 10MB.
- uploading my pmtiles file to a Cloudflare R2 bucket using the rclone CLI.
- creating a Cloudflare worker to serve the HTTP requests on a subdomain. When the requests come in to pmtiles.larryhudson.net, the Cloudflare worker renders the data from the pmtiles file in the bucket.
I followed these instructions on the Protomaps website.
I had a little bit of difficulty getting this working. One step that I missed initially, was setting the ‘ALLOWED_ORIGINS’ environment variable, so that requests from my localhost:4321 development server would be allowed. Overall, this process took me around 30 mins to set up, so it wasn’t too bad.
OpenStreetMap’s search API
OpenStreetMap has a search API called Nominatim that allows you to search for locations and get their coordinates. It makes it fairly easy to lookup data for a specific place or region, and get GeoJSON data that can be visualised on a map. For example, here’s a search URL to look up the polygon data for the 11th arrondissement of Paris.
OpenStreetMap allows developers to use the Nominatim API for free, but their usage policy only allows one request per second. While this is ok for a hobby project, if you need to make more requests, they have alternatives on their wiki.
OpenStreetMap is a real gift for developers who want to do interesting things with maps - I’m really interested in experimenting more.
It was fairly straightforward integrating a search box into my web app. Because the Nominatim API returns GeoJSON data, I was able to visualise that GeoJSON data using the functionality within Bishal’s example.
Generating images from ‘canvas’ elements
The last part of the puzzle was taking screenshots of maps, so that I can use them in Anki flashcards.
I’ve recently been playing with the html2canvas library after finding out about it in Andrew Walpole’s great example for generating social media images for blog posts here.
It turns out, if you can render a <canvas> element, it’s fairly easy to turn that into a screenshot using JavaScript. You just need to get the <canvas> element from the DOM and then do canvas.toDataURL('image/png').
Because the MapLibre library renders the map as a <canvas> element, I was almost there. I just needed to enable the preserveDrawingBuffer option so that the canvas would be able to be rendered to an image. This option is disabled by default for performance reasons.
One ‘gotcha’ that I ran into was with map markers - if I added markers using the MapLibre library, they were not rendered in the canvas, because they are added as separate DOM elements. To get around this, I added a ‘layer’ for each marker to the map. You can see that in the source code here.
An example flashcard
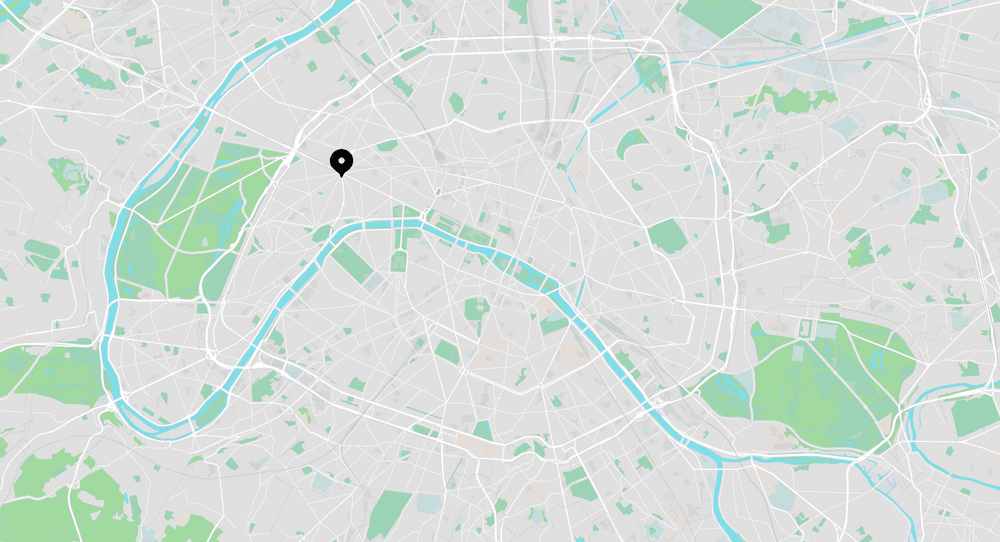
Where on the map is the Arc de Triomphe?
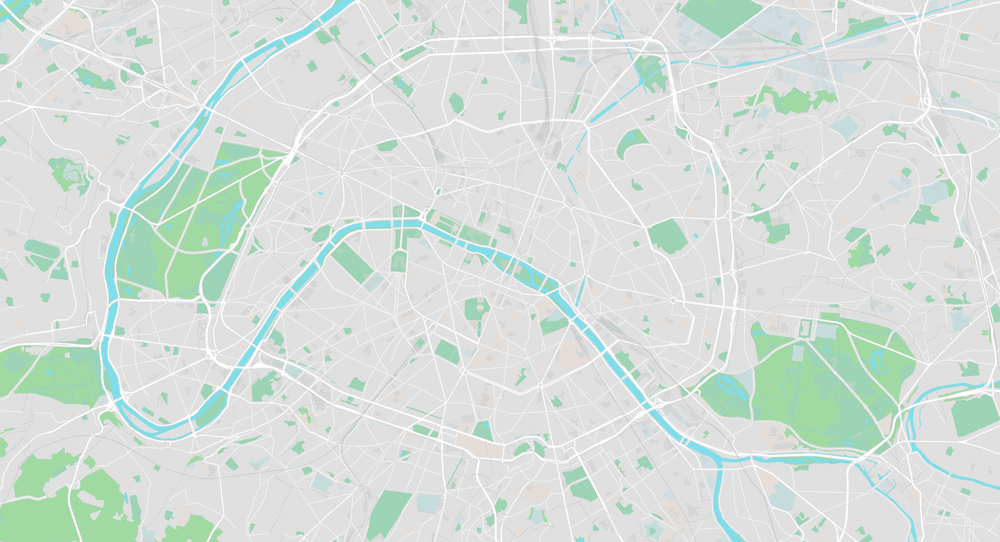
Show the answer
Video walkthrough and GitHub repo
You can view a video walkthrough of the web app here:
You can also explore the source code for the project on GitHub.
Let me know what you think
If this is interesting to you, I’d love to hear what you think. Have you made something similar? Do you have any other ideas for interesting use cases for mapping in a web app?